
AUDUSD Chart Technical Outlook the rally stalls at the 78.6% Fibonacci
USD Basket (non-weighted) – moving lower within a corrective channel formation. Trading close to channel support at 293. The intraday stance would be to sell into rallies close to 312.
AUD basket – buyers returned under the trend line support from the expanding wedge pattern. Although the long-term bias is bearish, there is ample scope to move higher toward 11.15 resistance.
Correlation studies suggest ample scope for AUD/USD to move higher in a corrective pattern.
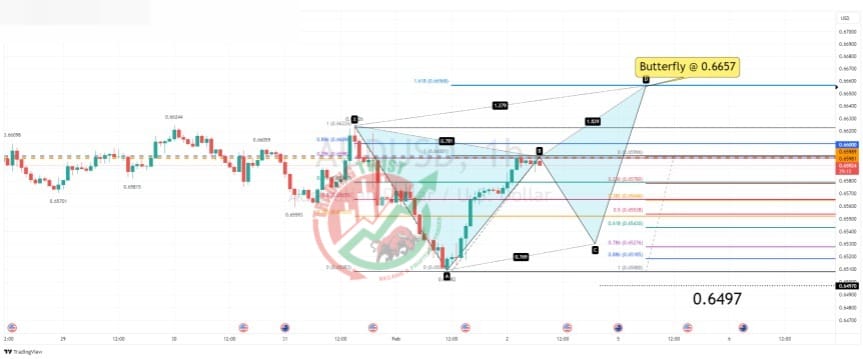
AUD/USD – the rally has stalled at the 78.6% pullback level of 0.6598. A correction lower from this important barrier would suggest we are building a bearish butterfly formation. This will be completed at 0.6657. The immediate bias is bearish.
Conclusion: with the long-term outlook still negative for AUD/USD, the system trade would be to sell into the completion of the butterfly formation at 0.6657. The first substantial downside barrier is located at 0.6497.
Resistance: 0.6598 (78.6%), 0


