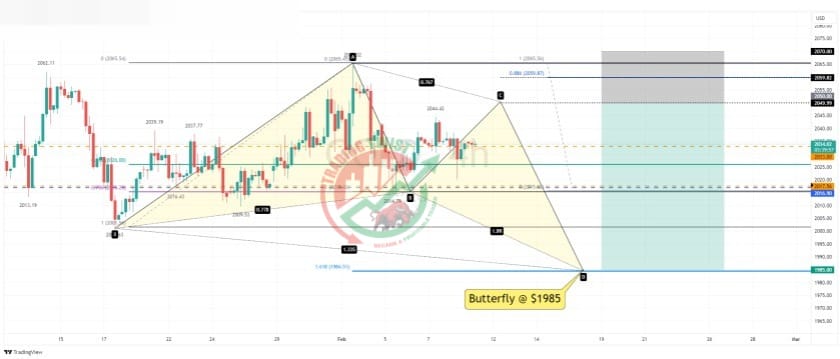
GOLD XAUUSD Chart Technical Outlook trades within the corrective BC leg
The four-hour chart highlights Gold trading within the BC leg of a Butterfly formation. This cycle of the cypher pattern is notoriously hard to trade. A common retracement level for the BC leg is an 88.6% pullback of the last decline. This level is located at $2,060.
The one-hour chart highlights a corrective channel formation. A full AB=CD corrective formation will take spot Gold to $2,050. We look to be forming a complex 5-3-3 pattern while inside this formation.
Conclusion: there is ample scope for a larger correction to the upside. I expect intraday trading to remain mixed and volatile. With the BC leg being corrective, it is wise to sell into strength (and not to trade the correction higher). Selling at $2,050 with a stop loss at $2,070 targeting $1,985 offers a risk-reward factor of 3.25R
Resistance: $2,044 (swing high), $2,050 (AB=CD), $2,060 (88.6%)
Support: $2,018 (bespoke), $2,015 (78.6%), $1,985 (butterfly)


