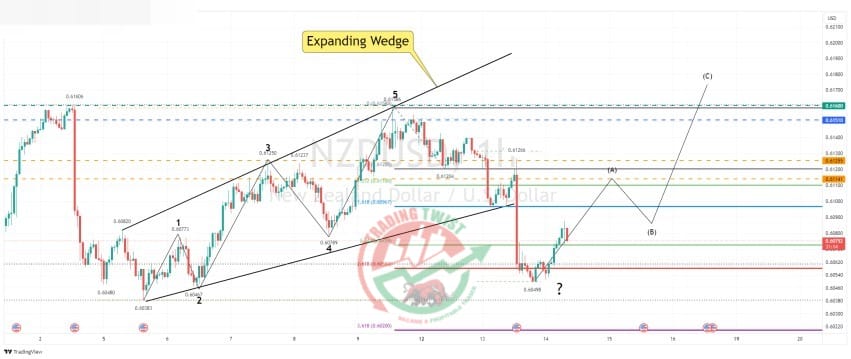
NZDUSD Chart Technical Outlook the correction may not be complete
The daily chart highlights NZD/USD building a cypher pattern known as a bat. This offers a long-term bearish bias. However, it is common for the BC leg to retrace either 38.2% or 88.6% of the last decline. Neither of these levels has been achieved.
The intraday chart highlights a breakout of the expanding wedge pattern. Corrective formations are normally complex. This would suggest there is scope for a higher correction. A break of the previous swing low at 0.6038 would indicate that the long-term trend has resumed.
Conclusion: The preferred stance would be to sell into a new February high.


