
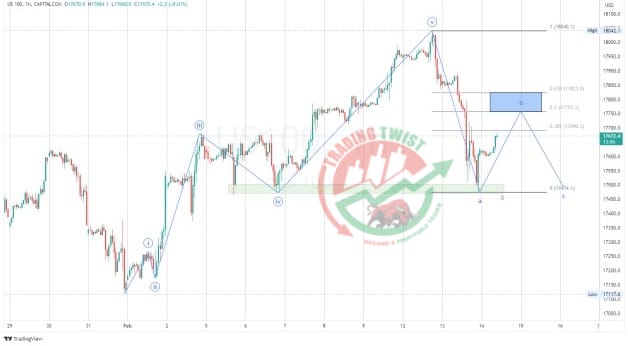
Nasdaq (US100) Chart Technical Outlook develops a corrective structure after the strong US inflation data.
Nasdaq’s broad bias is still bullish. The recent strong inflation data from the US pushed the USD higher and yields higher, which is bad for stocks. Prices stalled at a previous support. The index might develop a corrective structure. There is room for mild gains toward the resistance zone of 50% and 61.8% Fibo levels at 17,750 and 17,825. Corrective structures could take different shapes, zigzag or flat, simple or extended. Supports are located at 17,500 and 17,400.


