USDCAD Chart Technical Outlook on H4 time frame paidrifts lower for the second straight day amid a modest USD downtick.
•Sliding Oil prices undermine the Loonie and should help limit any further losses.
•The technical setup warrants caution before positioning for a meaningful decline.
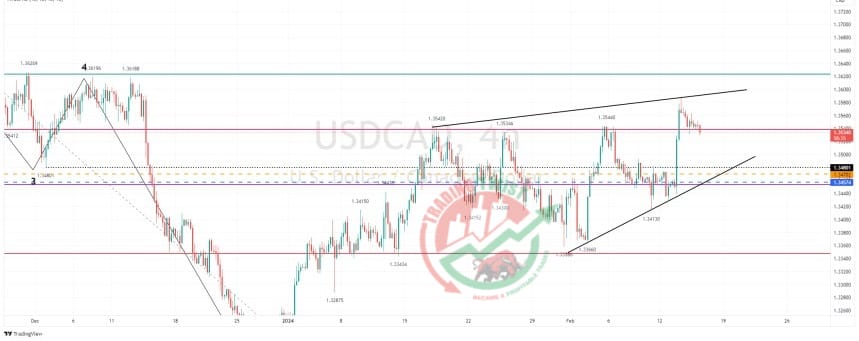
Sustained weakness below the latter might prompt some technical selling and drag the USD/CAD pair below intermediate support near mid-1.3400s, towards last week’s swing low, around the 1.3415-1.3410 region. This is closely followed by the 1.3400 mark, which if broken decisively will be seen as a fresh trigger for bearish traders and pave the way for additional losses.
On the flip side, the 100-day SMA, around the 1.3565 zone, followed by a two-month top near the 1.3585 region, might continue to act as an immediate hurdle. Some follow-through buying, leading to a move beyond the 1.3600 mark and the 1.3620 supply zone, could lift the USD/CAD pair to the 1.3700 mark en route to the next relevant barrier near the 1.3745-1.3750 region.