
USDJPY Chart Technical Outlook correcting lower within the 4th wave of a bullish Elliott Wave count
USD/JPY – the daily chart highlights an AB=CD formation at 154.44. We have the completion of a disjointed bearish Butterfly formation at 154.10 and 155.08. This is the medium-term resistance barrier (154.10-155.08).
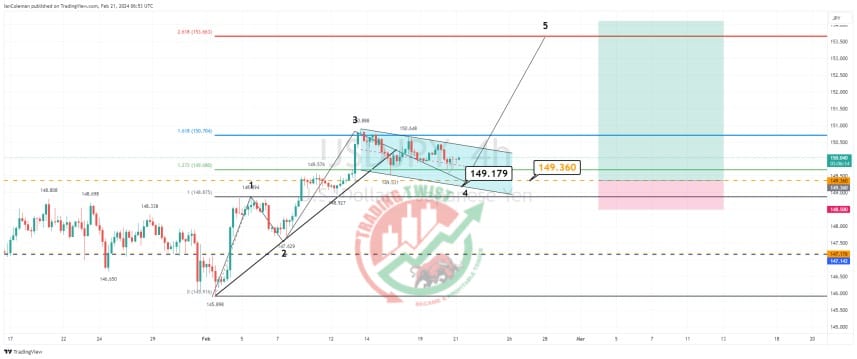
The intraday chart highlights the pair moving lower within a corrective 4th wave channel (bullish Elliott Wave count). Bespoke support is located at 149.36. This formation will be broken on a move through 148.90 (Feb 5 swing high)
Conclusion: Buying a dip at 149.36 (bespoke), targeting 154.10 (medium-term resistance), with a stop loss at 148.50 (breaking the count), offers a risk-reward factor of 5.51 R.
Resistance: 150.88 (swing high), 153.66 (261.8%), 154.10-155.08 (medium-term barrier)
Support: 149.36 (bespoke), 149.18 (channel base), 148.90 (swing high, 1st wave)


