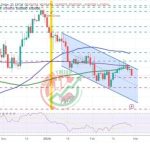
US Crude Oil Chart Technical Outlook the immediate bias is bullish, with rallies to be sold
We have seen mixed trading results for the last 56 days. This has resulted in a large expanding wedge formation that has an eventual bias to break to the downside.
Inside this formation is a bullish channel. Trendline resistance is located at $81.69. Trend line support is located at $76.40.
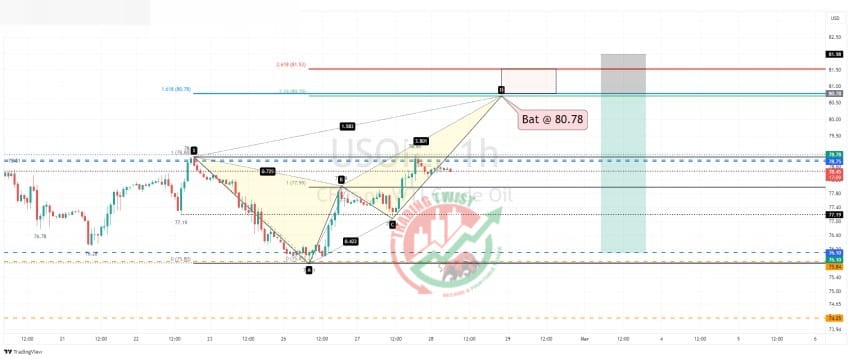
The intraday chart highlights the completion of a bearish Bat formation at $80.78. We have a 261.8% extension level located at $81.53. .
Resistance: $80.78 (Bat), $81.53 (261.8%), $81.69 (trend line)
Support: $77.99 (swing high), $76.10 (bespoke), $74.25 (bespoke)