
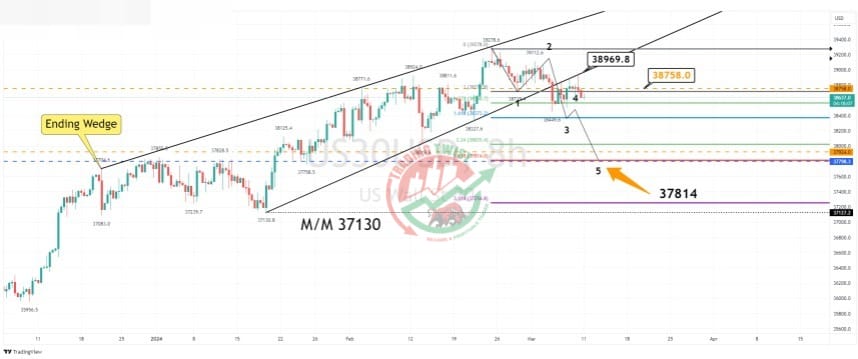
US 30 Chart Technical Outlook I would always look at a combination of fundamental and technical analysis. US30 had a wedge breakout with reverse trendline resistance. The one-hour chart highlighted an expanding wedge formation that has a bias to break to the downside. Most high-volatility events will only change the trend if it is at or close to a technical level. I’ve been writing about the fact that US30 has topped out. The news on Friday was just a technical correction.


