
Dow Jones (US30) Chart Technical Outlook the immediate bias is skewed to the downside
The focus today will be the Consumer Price Index (CPI), a market-moving inflation report from the United States. I am expecting high volatility.
Although the data is unpredictable, we can sometimes gain a bias from chart analysis. It would be wise to look at DXY (the USD Index).
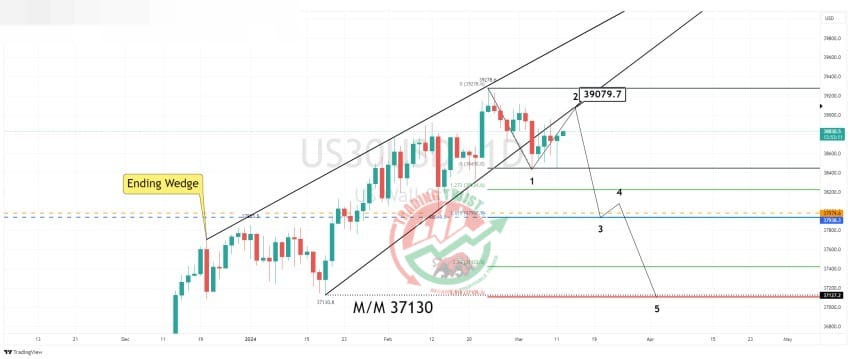
US30 – the daily chart highlights a breakout of an ending wedge formation. The measured move is located at 37,130. We have seen mixed and volatile trading for the last four sessions with spikes seen in both directions. This highlights indecision up to the inflation report. The most important factor in this time frame is the fact that the 161.8% extension and 261.8% extension line up with substantial support zones. I am looking for a bearish Elliott Wave count (5 waves) to complete after the corrective second wave.
The one-hour chart highlights a stalling in bullish momentum close to the 78.6% pullback level of 38,848. This would suggest we are forming a bearish Bu


