
Dow Jones (US30) Chart Technical Outlook the index could climb to 39,480
Although we have seen a mixed and volatile price action for the last 13 days, dips continue to find buying interest. The index currently trades close to the all-time highs. Let us look at the big-picture analysis.
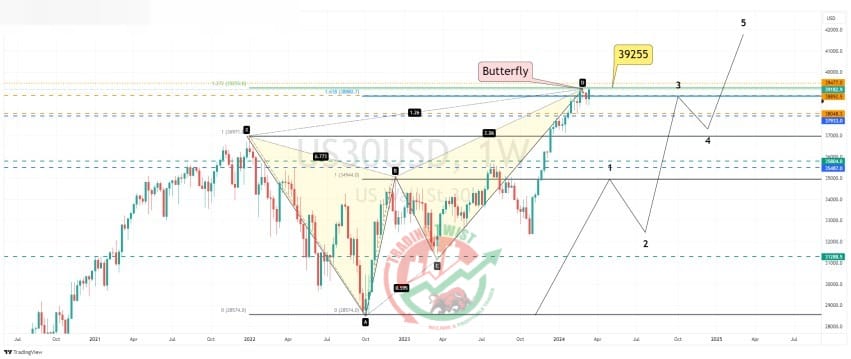
The weekly chart highlights the completion of a bearish Butterfly formation at 39,255. This could also be seen as the completion of the third wave in a bullish Elliott Wave count (5 waves) Both scenarios would suggest a substantial correction to the downside.
The intraday chart highlights a double bottom formation. The measured move target for this pattern is located at 39,480. We have a 261.8% extension level located at 39,480.
The daily chart highlights a breakout of an ending wedge formation. However, this bearish move was false, and we have seen a rally back inside the formation.
Bespoke support is located at 38,892 and 37,933. Using the intraday resistance level at 39,480 offers a projected Elliott Wave countdown to this important support.


