
GOLD XAUUSD Chart Technical Outlook projection analysis highlights $2,263 as a medium-term swing high. The USD index is negatively correlated with Gold. That would suggest further upside pressure for the yellow metal.
Gold – Although we posted a doji-style candle on March 21, I can see no technical reason for a change in the bullish trend.
The daily chart highlights the trend of higher highs located at $2,263. Bespoke support levels are located at $2,154, $2,085, and $1,983. Using $2,263 as a projected top offers a bearish Elliott Wave count (5 waves) to these important levels.
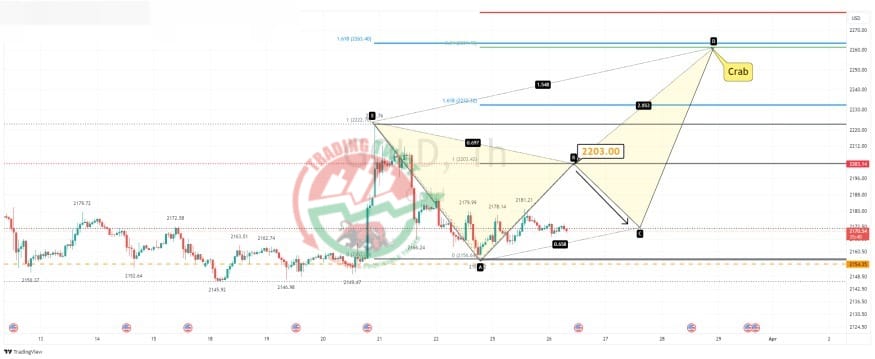
The intraday chart highlights the next substantial upside barrier being $2,203. This would be the completion of the AB leg in a Crab pattern.
Resistance: $2,203 (projected AB), $2,223 (all-time high), $2,263 (projected swing high)
Support: $2,154 (bespoke), $2,085 (bespoke), $1,983 (bespoke)


