
EURUSD Chart Technical Outlook correlation suggests limited selling ahead of the PCE data
Today’s focus will be on personal consumption expenditure data (PCE), the Fed’s preferred inflation gauge. We are expecting a print of 0.3% (MoM) and 2.8% (YoY). With low liquidity markets over the Easter Bank holiday, a deviation from the expected could have a dramatic effect on USD products.
EUR basket-support levels are located at 615 and 582. Using projection analysis, and the Elliott Wave theory, there is ample scope for a move to the upside in wave 2.
Correlation studies offer a mild bullish bias for EUR/USD.
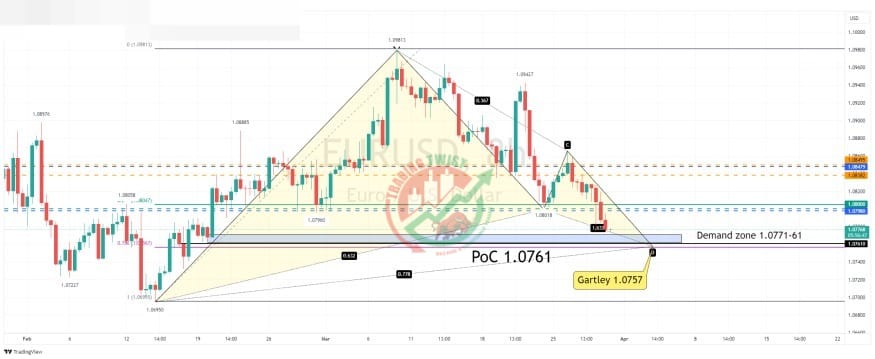
The 8-hour chart highlights a bullish Gartley formation completing at 1.0757. We have a demand zone located at 1.0771-61. We have the point of control (PoC) from Feb 15 located at 1.0761.
Resistance: 1.0838 (bespoke), 1.0849 (bespoke), 1.0981 (swing high)
Support: 1.0771-61 (demand zone), 1.0757 (Gartley), 1.0695 (swing low)


