
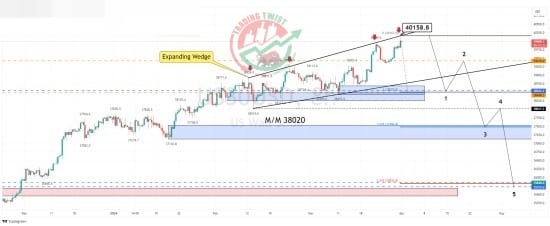
Dow Jones (US30) Chart Technical Outlook the wedge top is located at 40,158
The index continues to post higher highs and higher lows with a new all-time high of 40,031 posted overnight. There are warning signs that further gains could be limited.
Price action has formed a bearish expanding wedge pattern. Trend line resistance is located at 40,158. It should be noted that this will be the 4th touch of the trend line, a common price rejection.
Bespoke support is located at 38, 542, and 35,850.
Combining these levels with the smart money concept (SMC) highlights a clear Elliott Wave count (5 waves) to the downside.
Conclusion: although there is no immediate indication of a change of trend, selling into rallies close to the trendline resistance at 40,158 offers a medium-term high-value trade with the eventual target not seen until 35,830.
Resistance: 40,031 (new all-time high), 40,158 (trendline resistance), 40,500 (Big Figure)
Support: 39,420 (bespoke), 38,542 (bespoke), 38,848 (bespoke)


