Dow Jones (US30) Chart Technical Outlook breaks the expanding wedge, scope for an upside correction to sell into Fed’s Kashari and Goolsbee noted that it is possible the Fed will not cut this year if inflation stalls (stays high). This resulted in U.S. stocks moving to the downside and a run to safe-haven assets.
The 8-hour chart highlights continued downward momentum from the 40,031 all-time high.
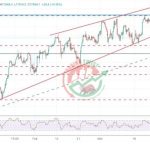
We have broken out of the expanding wedge formation to the downside. This pattern has a measured move target of 38,020. Bespoke support is located at 38,374 and 35,725. Using a Fibonacci extension tool from this support level (38,374) offers a 261.8% extension level at 35,693. The medium-term focus remains on the downside.
The one-hour chart highlights a supply zone between 39,269 and 39,457. Bespoke resistance is located at 39,269.
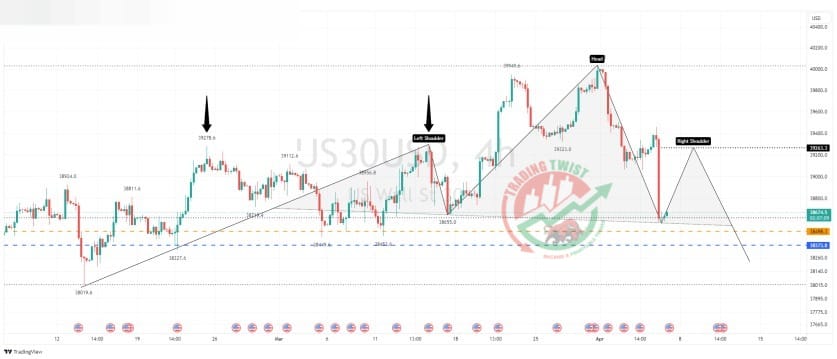
Looking at the four-hour chart, a correction to the upside would form the right shoulder of a bearish head and shoulders formation (it is too early to calculate the measured move target).
Conclusion