
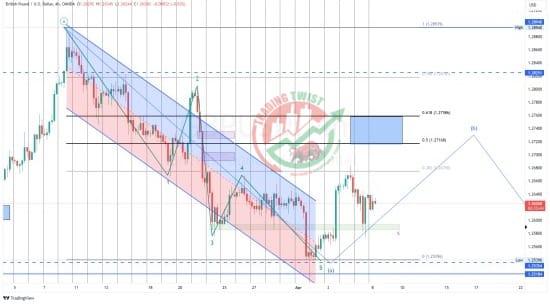
GBPUSD Chart Technical Outlook printed a higher high last week, bulls can revisit 1.2680
GBP/USD has been consolidating this year, developing an extended WXY corrective structure. Prices completed a five-wave downside leg as wave a from wave Y. A corrective upside leg is expected. Prices have bounced from a previous swing low from March at 1.2575 despite the strong NFP last Friday. It printed a higher high last week at 1.2683. If that level is broken, there is room for further gains toward the resistance zone between the 50% and 61.8% Fibo levels at 1.2715-60. Supports are located at 1.2590 and 1.2550. I’m holding my buy order form the last week.


