
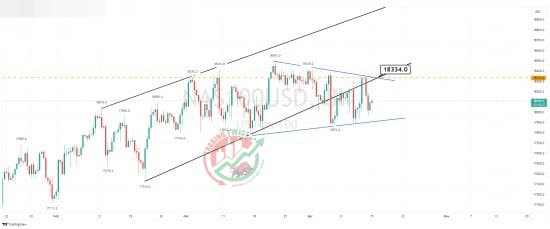
Nasdaq 100 Chart Technical Outlook (US100) two patterns offer resistance at 18,334
We have seen continued mixed and volatile trading in the index with prices consolidating close to the all-time high of 18,497. We have two formations both offering resistance close to 18,334.
- We have broken out of an ending wedge formation to the downside (bearish). This offers reverse trendline resistance at 18,334.
- The mixed and volatile trading has resulted in a symmetrical triangle formation bullish). This offers trendline resistance at 18,334.
- Bespoke resistance is located at 18,334.
Conclusion: Although the chart patterns offer a mixed medium-term bias, 18,334 looks like strong intraday resistance.


