
US CRUDE OIL Chart Technical Outlook skimmed the support, sellers return
With tensions in the Middle East intensifying, we witnessed a strong rally in oil during the Asian session. Dip buying skimmed our support zone of $80.74 – $79.90.
Iran official says ‘there was no attack from outside the country on our territory’. (source: Al Arabiya). We are seeing a move to the downside in US Crude Oil as market nerves calm.
From a technical perspective, the trade signal to buy at $80.74 is still valid.
The daily chart highlights a move lower within the BC leg of a Crab formation. A common retracement level is 38.2% of the last rally. This downside barrier is located at $79.90.
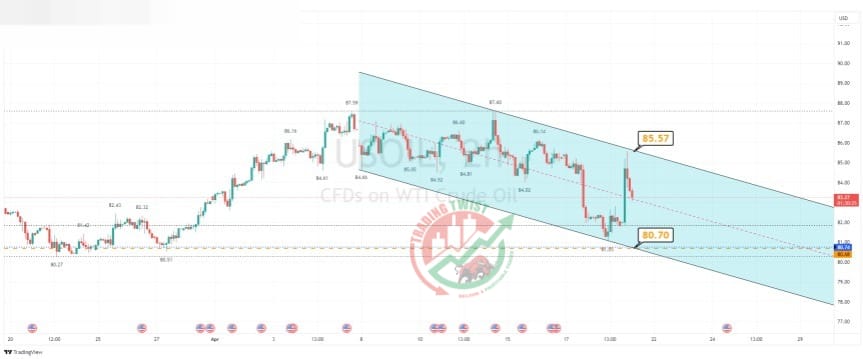
Resistance: $85.57 (trend line), $87.60 (swing high), $112 (Bat)
Support: $80.74 (bespoke), $80.70 (trend line), $79.90 (38.2%)


