US CRUDE OIL Chart Technical Outlook dip buying offers good risk reward
The daily chart highlights US Crude Oil moving lower within the BC leg of a large Crab formation. A common retracement level is 38.2% of the last rally. This support is located at $79.87. The cypher formation will be completed at $112.00.
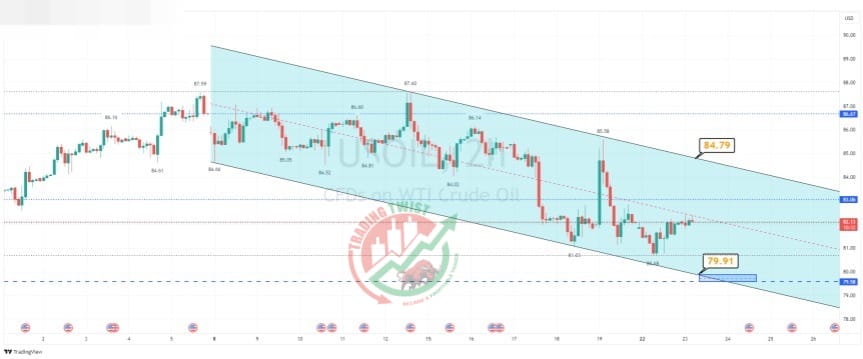
The intraday chart highlights a corrective bearish channel formation. Trend line support is located at $79.91. Bespoke support is located at $79.58.
Resistance: $84.79 (trend line), $87.60 (swing high), $112 (Crab)
Support: $79.91 (trend line), $79.87 (38.2%), $79.58 (bespoke)


