
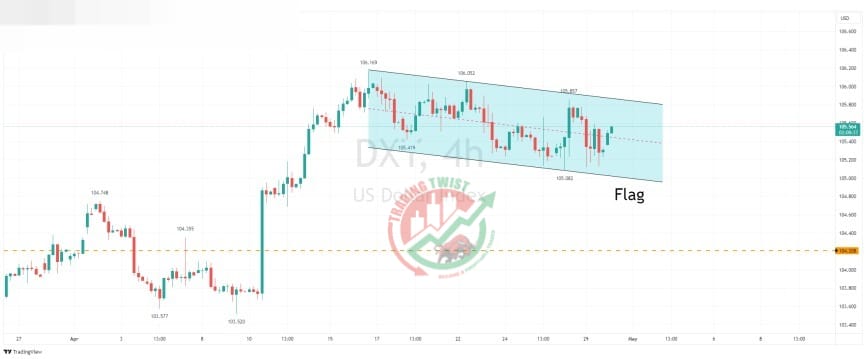
DXY (USD Index) Chart Technical Outlook. The four-hour chart highlights the index consolidating within a corrective channel formation. This could be seen as a flag with a bias to break to the upside.
The one-hour chart highlights the completion of a bearish gartley formation at 105.70. We have a supply zone located at 105.68. Although the medium-term bias is bullish, I look for intraday rallies to find selling interest.


