Dow Jones US30 Chart Technical Outlook confluence zone located at 38,966
The index has continued to trend higher since posting the 37,711 swing low on May 1. Four time frames suggest limited further buying pressure:
- The daily chart highlights a 61.8% extension level located at 38,966.
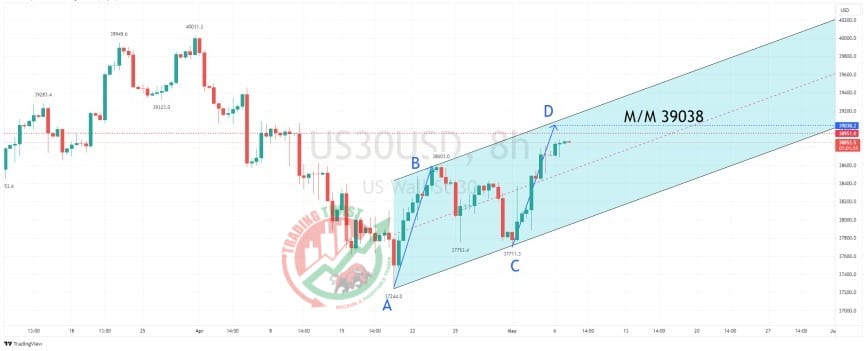
- The eight-hour chart highlights an AB=CD corrective formation being completed at 39,038.
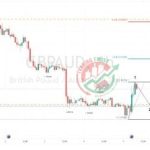
- The four-hour chart highlights the completion of a bearish Gartley formation at 38,972.
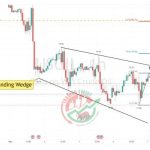
- The one-hour chart highlights a bearish ending wedge formation. We have a previous supply zone between 38,951 and 39,000
Resistance: 38,966 (61.8%), 38,972 (Gartley), 39,037 (AB=CD)
Support: 38,770 (higher lows), 38,435 (wedge target), 37,886 (swing low)