
GBPUSD Chart Technical Outlook offers a negative bias going into today’s Bank of England interest rate decision
We are trading within the BC leg of a Crab formation. Common retracement levels are the 38.2% (1.0279) and 88.6% (1.0671) pullback of the last rally. The minimum requirement of 1.2079 has been achieved.
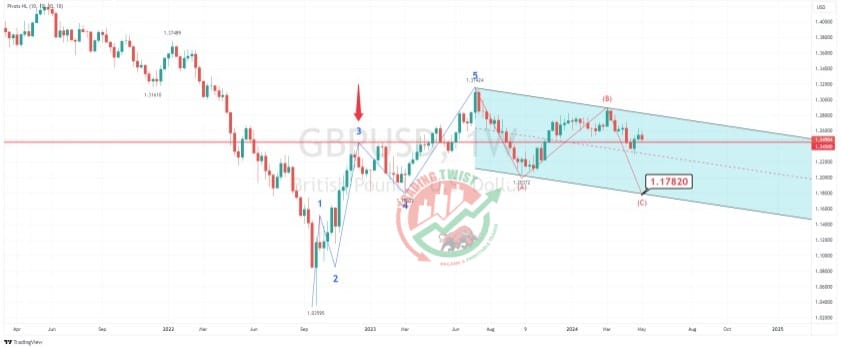
Weekly chart: five waves up will normally be followed by three waves down (Elliott Wave theory). We are currently trading within a corrective channel formation. Trend line support is located at 1.1782. We have a pivot at 1.2450.
One-hour chart: we are in a bearish Elliott Wave count (5 waves). The 261.8% extension level is located at 1.2359. A break of formation will occur on a move through 1.2530.
Resistance: 1.2530 (breaker structure), 1.2572 (bespoke), 1.2635 (swing high)
Support: 1.2467 (yesterday’s base), 1.2450 (weekly pivot), 1.2359 (261.8%)


