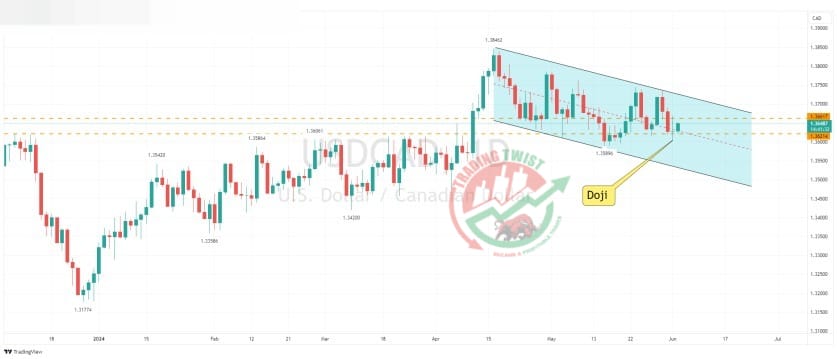
USDCAD Chart Technical Outlook Doji Candle highlights the lack of clear direction
We are seeing nasty price action in the cross with both oil (weakening the Canadian dollar) and DXY (USD Index) moving to the downside. With both single currencies moving in the same direction, this is causing intraday volatility. This lack of clear direction is highlighted on the daily chart with a doji-style candle posted within the corrective channel formation.
Breaking down into a shorter time frame gives no clearer picture. We are currently trading between bespoke support at 1.3621 and bespoke resistance at 1.3662. Until we can note a clear pattern, I would expect this cross-currency to remain volatile. It is best to step aside.


