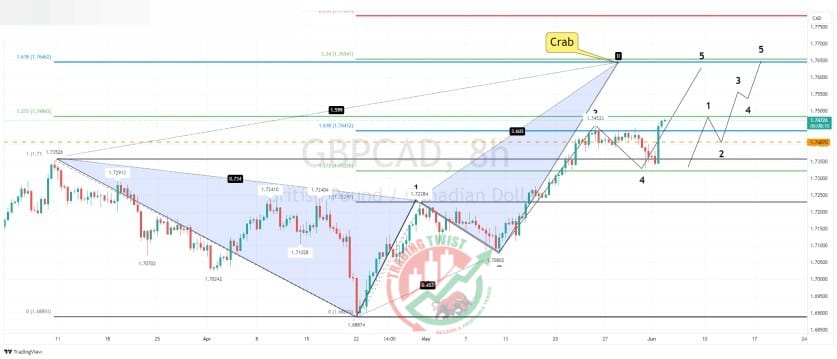
GBPCAD Chart Technical Outlook moving higher to the confluence zone
Moving higher within the 5th wave of a bullish Elliott Wave count (five waves). We have a confluence area between 1.7646 and 1.7654. This would highlight a bearish Crab pattern.
It should be noted that the 5th waves tend to be extremely mixed and volatile. There is ample scope for a move lower within the sub-wave. Intraday support is located at 1.7407. In conclusion, the medium-term bias remains bullish. I look for dips to be bought.


