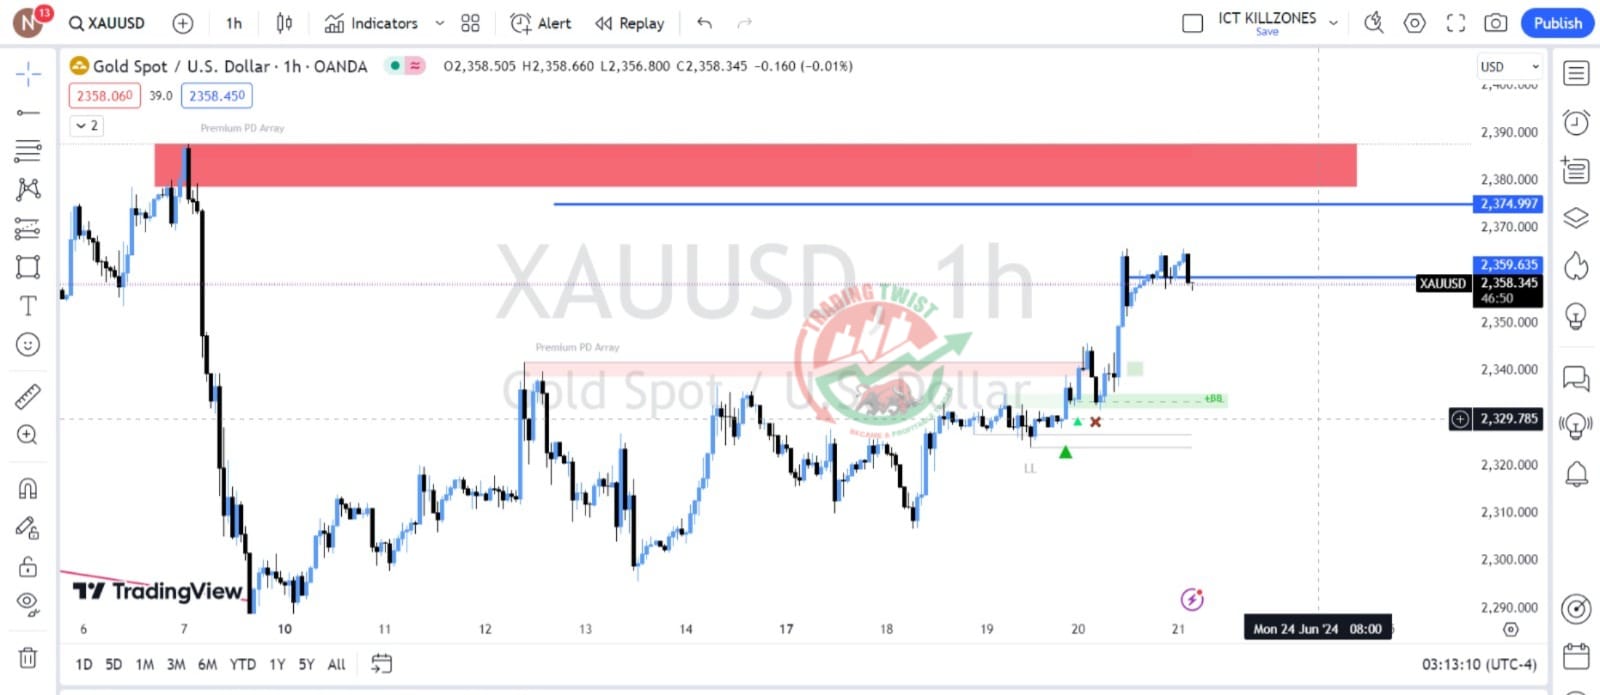
Gold XAUUSD Chart Technical Outlook defies rising yields and may extend gains toward $2,388 on fresh US data.
When an asset goes up on the backdrop of bad news, it has more room to rally if things further improve. US 10-year yields are inversely correlated with yieldless Gold – when they rise, the precious metal tends to fall. However, there is strong buying momentum boosting Gold, and it advanced despite an increase in yields.
What’s next? The S&P Global PMIs are due out later today, and if they show further weakness in the US economy, XAU/USD may extend its gains. Data has been soft in recent days.
Gold faces resistance at the recent high of $2,366 and then the early June peak of $2,388. Support is at $2,352, followed by $2,341 and $2,324. On its way up, XAU/USD broke above the 4h-200 SMA, while the 4h-RSI is still below 70 – outside overbought territory. Therefore, it has more room to rise.


