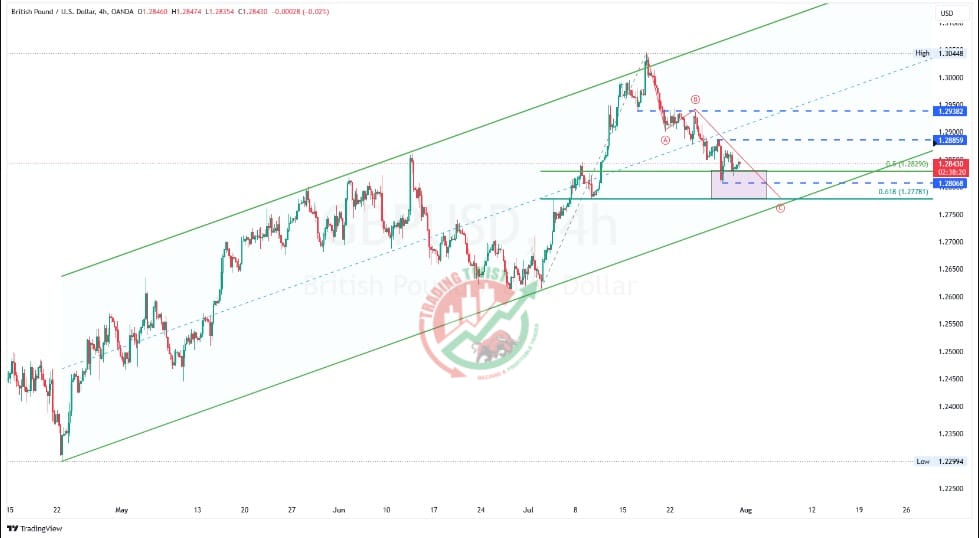
GBPUSD Chart Technical Outlook trades in a bullish channel. Prices move south toward the lower line, overlapping with the support zone of 50% and 61.8% Fibonacci retracement levels. I expect the dip to find buyers ahead of today’s FOMC meeting.
Supports are located at 1.2780-1.2800. A dovish Fed can help prices bounce higher toward 1.2885, as the first resistance line, and 1.2935, as the second one.