
WTIUSD Chart Technical Outlook Crude Oil (XTI/USD) exposes its weakness, at risk of further falling to $72.84 and below
Issues with oil fields in Libya? Not a problem for oil bears. A drop in supply should have pushed the price higher, but the bounce in crude seems to have faded at an early stage.
Oil bulls have bigger headwinds, most notably concerns about Chinese demand. Beijing recently published a disappointing Manufacturing PMI figure for August, implying no rise in demand.
With US traders returning to their desks after the long Labor Day weekend, there is room for more volatility – but not change in the downtrend.
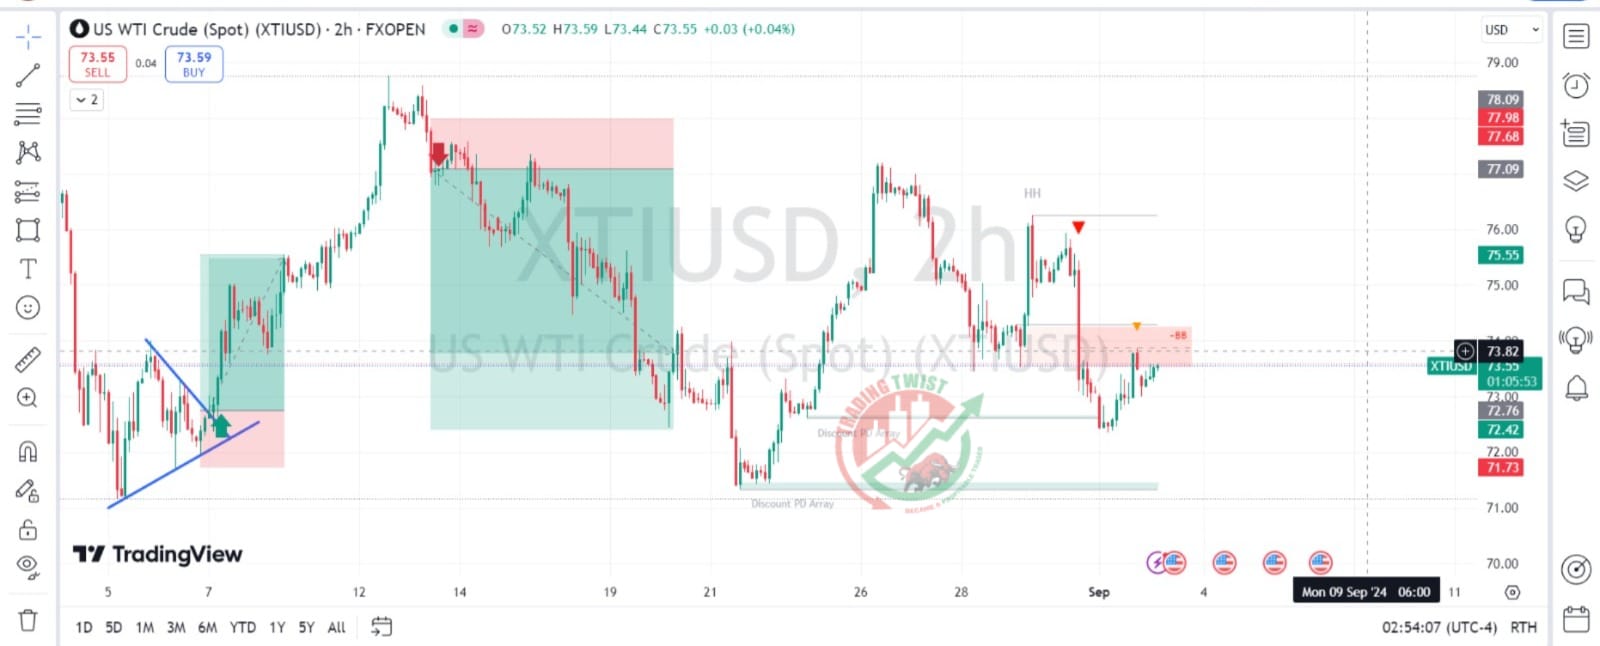
XTI/USD has support at $72.84, the recent low, followed by $71.48 and $70.47. Resistance is at $74.41, and then $76.86, which is followed closely by $77.59. The broad trend remains down.


