
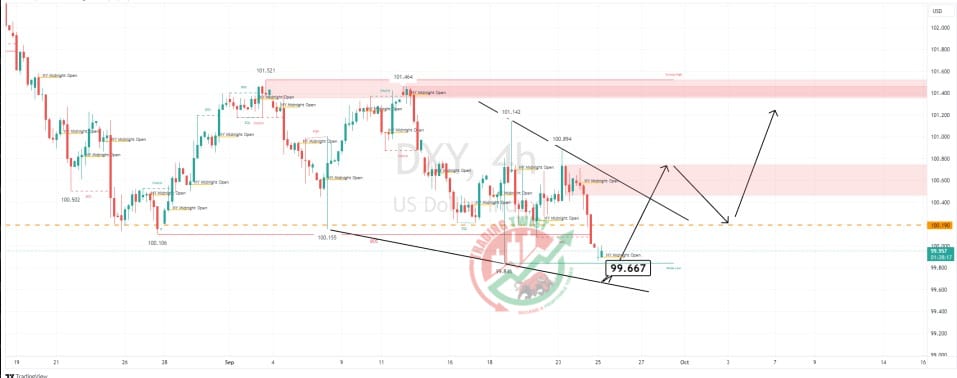
DXY Chart Technical Outlook (USD Index – Capital) highlights an ending wedge pattern, support is 99.67
We have witnessed mixed and volatile trading since the US interest rate cut. This lack of clear direction has resulted in an ending wedge pattern being posted on the intraday chart. The trend of lower lows (support) is located at 99.67. A bespoke support level is located at 100.19. My preferred stones would be to wait for a breakout of the formation and a retest of support.


