
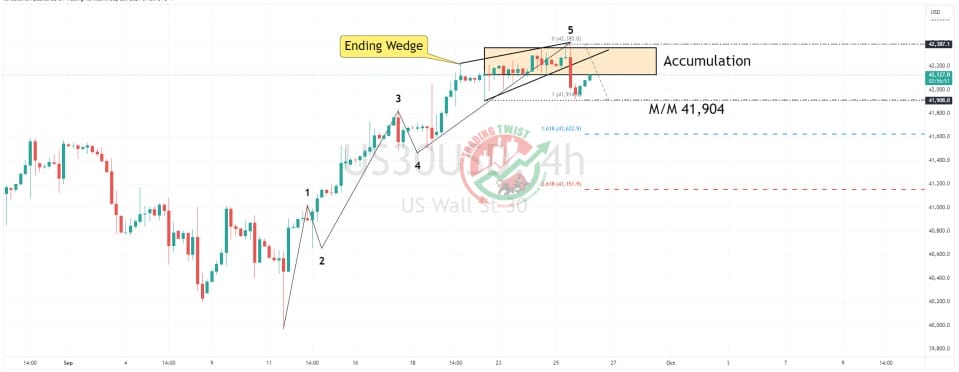
Dow Jones US30 Chart Technical Outlook breaks the wedge formation to the downside, and the measured move target is 41,904.
Strong selling pressure from the 42,385 all-time high resulted in the index breaking out of the ending wedge formation to the downside. The measured move target of 41,904 has yet to be achieved.
The previous consolidation is analyzed as a Wyckoff accumulation period. The spring higher is regarded as a false breakout.
We have posted bearish outside candles on the daily, the 8-hour chart, the 6-hour chart, and the 4-hour chart. These patterns often indicate the end of a trend and the start of a new downward bias.
Conclusion: I look for corrective intraday rallies to find selling interest. We have a 261.8% extension level located at 41,152.
Resistance: 42,124 (accumulation), 42,260 (reverse trend line resistance, wedge breakout), 42,385 (all-time high)
Support: 41,904 (measured move), 41,623 (161.8%), 41,152 (261.8%)


