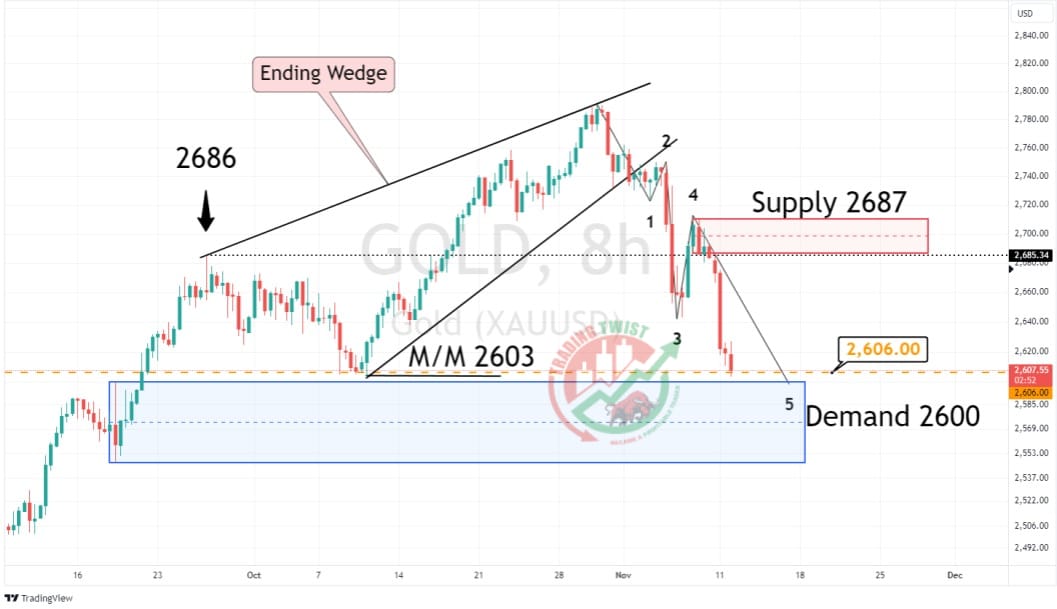
GOLD XAUUSD Chart Technical Outlook The wedge target of $2603 has been achieved
The monthly chart highlights a move to the downside from the 261.8% extension of $,2785. Elliott Wave enthusiasts will consider this the completion of a 5-wave count and the start of a correction to the downside.
The weekly chart produced an Evening Doji Star formation. This pattern is often seen at the top of the trend and the start of a new downward bias.
The 8-hour chart highlights a breakout of the Ending Wedge formation. The measured move target of $2,603 has been achieved. Bespoke support is located at $2,606. We have a demand zone from September 18 at $2,600.
To the upside, the previous swing high from September 26 is at $2,686. We have a supply zone from November 7 at $2,687. We can note a bearish 5-wave count to the downside (Elliott Wave)
Conclusion: with the weekly chart posting a reversal formation, the medium-term focus is fixed on the downside. However, we now look for a corrective move higher toward the $2,686 – 2687 barrier.
Resistance.


