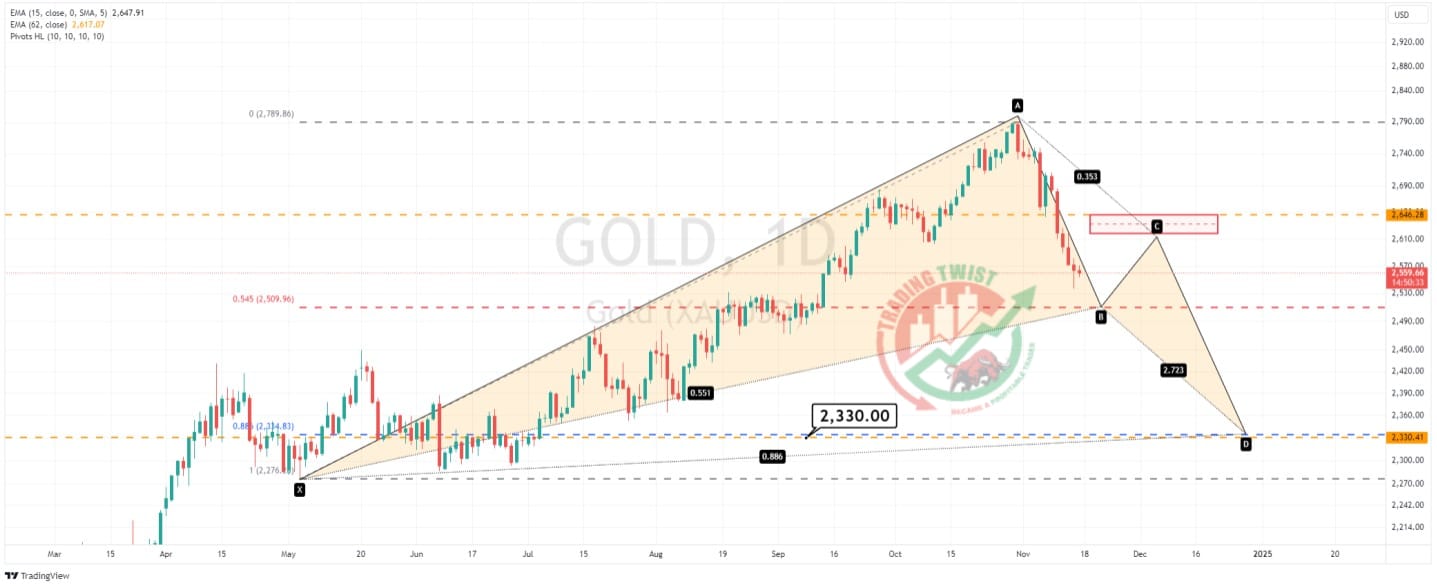
Gold XAUUSD Chart Technical Outlook projected support is located at $2,510
The monthly chart highlights a substantial sell-off with sellers emerging close to the 261.8% extension level of $2,785. Suggest the completion of a bullish 5-wave count and the start of a correction to the downside (Elliott Wave)
The weekly chart highlights an evening doji star formation. This pattern is often seen at the top of a trend and at the start of a new downward bias.
The daily chart highlights the support level of $2,330 being close to the 88.6% pullback level of $2,334. Cypher pattern analysis suggests a corrective bounce close to $,2510. This is analyzed as the corrective BC leg in a Bat formation. Upside rallies can be limited.
Conclusion: the monthly Elliott Wave completion and the weekly Evening Doji Star keep the medium-term focused on the downside. $2,510 is prime support.


