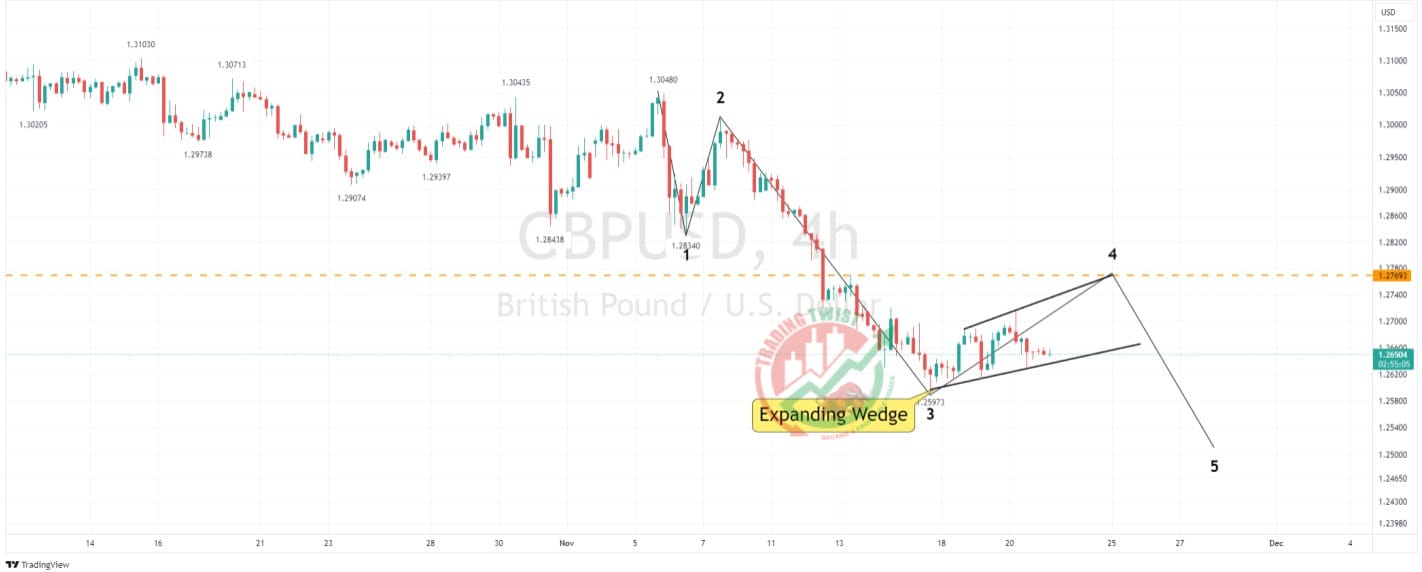
GBPUSD Chart Technical Outlook corrects higher in an Expanding Wedge, with resistance located at 1.2770.
We have seen a strong sell-off since GBP/USD completed the bearish Butterfly formation on September 26.
Last week’s negative price action resulted in a Marabuzo candle on the weekly chart (opens and closes near the high and low with little spikes). This highlights the strength of the decline. It has also resulted in a Marabuzo resistance level of 1.2760.
The intraday chart shows the pair correcting higher within a fourth wave of a bearish Elliott Wave count (five waves). We are within an Expanding Wedge pattern that has an eventual bias to break to the downside. Bespoke resistance is located at 1.2769.
Conclusion: the medium-term bias is still firmly fixed to the downside. With bespoke resistance being close to the Marabuzo barrier, our preferred stance is to sell into a higher correction.
Resistance: 1.2733 (higher highs), 1.2760 (Marabuzo), 1.2769 (bespoke)
*Support: 1.2635 (higher lows), 1.2597 (November


