Dow Jones US30 Chart Technical Outlook trades higher within the Ending Wedge pattern, the formation has a measured move target of 41,668.
Mixed daily results have resulted in the index posting a bearish Ending Wedge formation. Trendline resistance is currently located at 45,085, and trendline support is located at 43,260. There is ample scope for a move in either direction. The eventual bias is to break to the downside. The measured move target is 41,668.
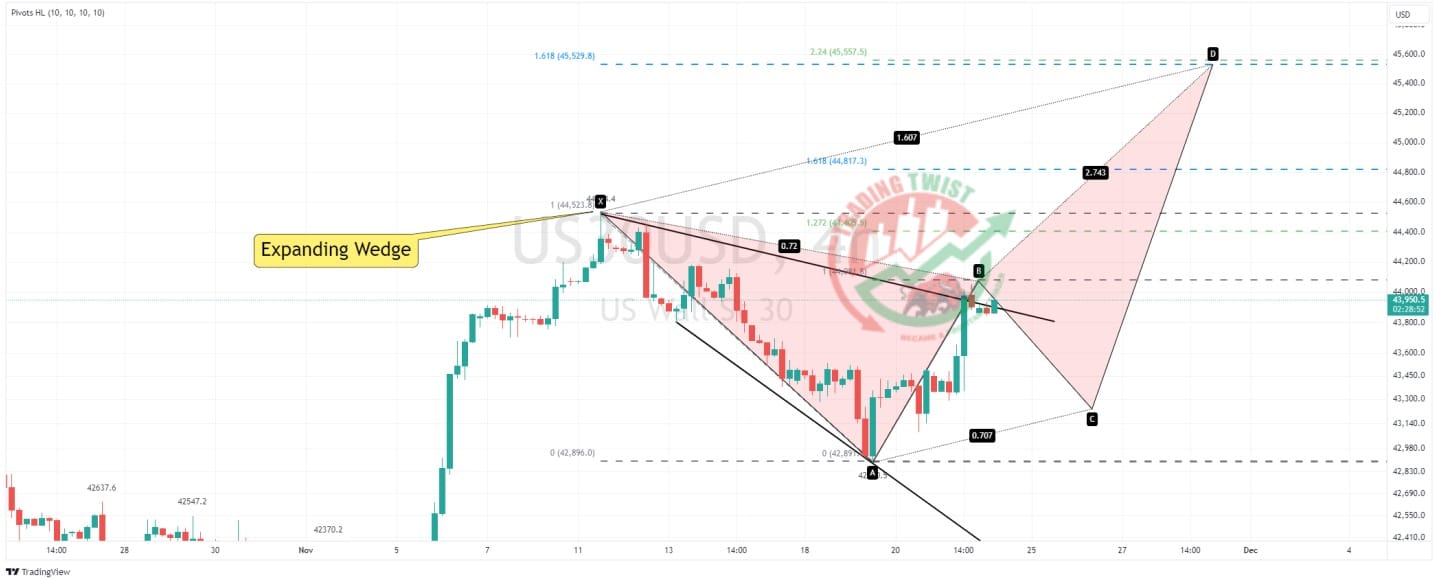
The intraday chart highlights an Expanding Wedge pattern with a bullish bias. A retracement from current levels would suggest we are building a bearish Crab formation, which will be completed at 45,530.
Conclusion: Although the medium-term bias is for lower levels, there is ample scope for further buying pressure after completing the BC leg.
Resistance: 44,082 (projected AB leg), 45,085 (current trend line resistance), 45,530 (Crab)
Support: 43,302 (confluence zone), 42,890 (swing low) 42,253 (bespoke)


