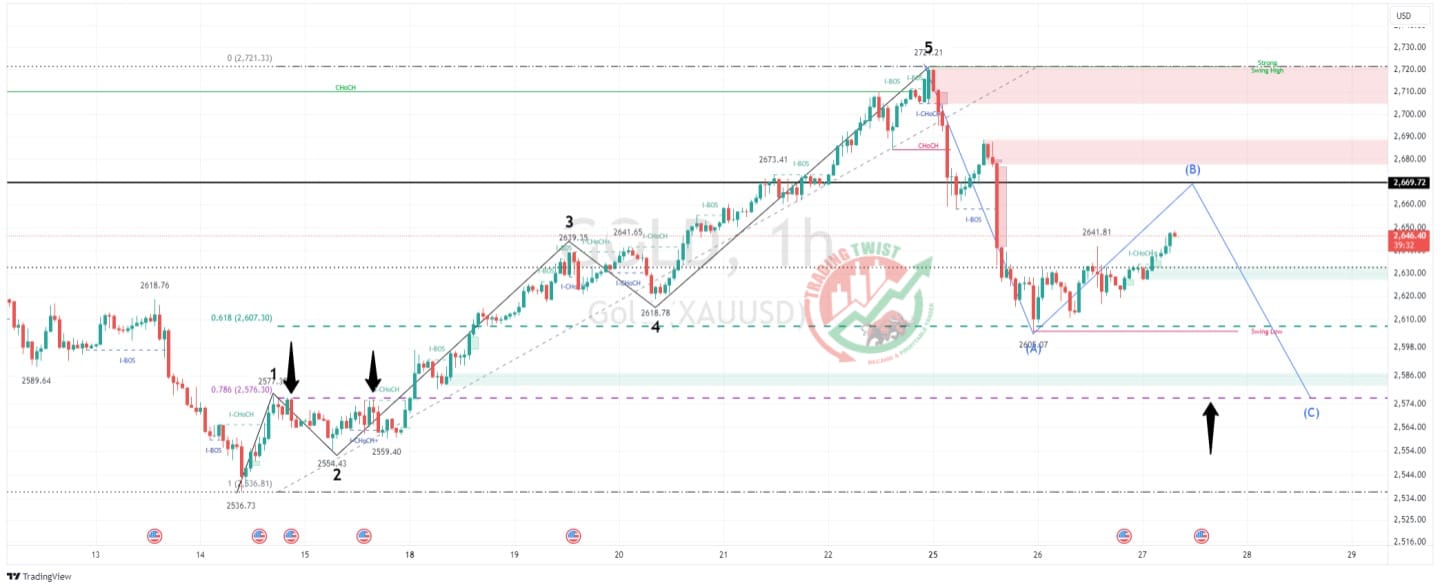
GOLD XAUUSD Chart Technical Outlook 2670 in focus Good to sell again
The big-picture analysis shows that we are building a bearish crab pattern. This will be completed close to $2,950. That would dictate we are currently trading within the unpredictable and corrective BC leg. The four-hour chart highlights a demand zone at $2,571
The one-hour chart highlights the last leg higher being in five waves. Elliott Wave analysis suggests we are trading within the corrective ABC leg lower. We have seen buyers return close to the 61.8% pullback level of $2,607. Resistance is located at $2,669.
Conclusion: we need to monitor price action at $2,669 for bearish signals. This corrective formation will be completed at close to $2,577. I would then expect another medium-term leg to the upside.


