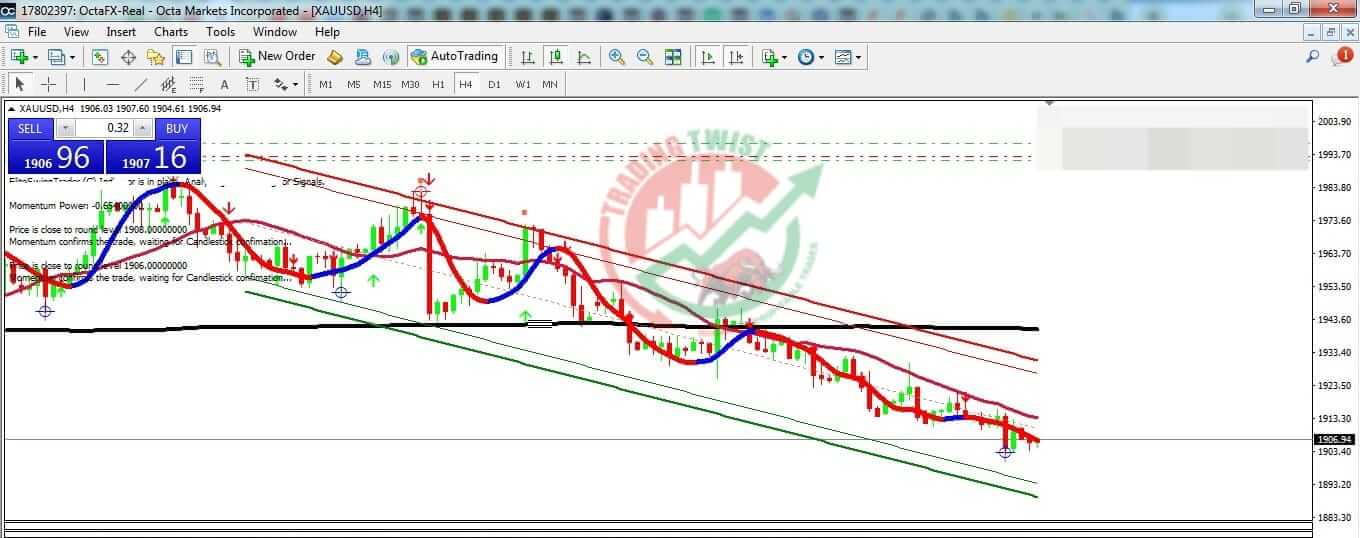
Gold XAUUSD Chart Technical Outlook, Don’t buy until hold break above 1920 or test 1989. Gold Price stays well beneath the key $1,925 resistance confluence comprising the 50-SMA on the four-hour (4H) formation, Fibonacci 38.2% on one-week and 161.8% on one-day.
Also keeping the XAU/USD bears hopeful is the quote’s clear downside break of the $1,918 support encompassing Pivot Point one-month S1, previous daily high and 100-HMA.
It’s worth noting that a convergence of the previous weekly low and the Fibonacci 61.8% on one-day, also known as the Golden Fibonacci Ratio, restricts the XAU/USD’s immediate upside near $1,912.
With this, the Gold Price appears well set to drop toward the previous monthly low of around $1,901 encompassing the Pivot Point one-week S1 and one-day S1, as well as the lower band of the Bollinger on the one-day.
However, the quote’s weakness past $1,901 has a space to fill unless hitting the yearly low marked in June around $1,893. Following that, Pivot point one-day S3 and one-week S2, near $1,888, will act as the last defense of the Gold bears.
Gold An upside break of the $1,920 resistance confluence could propel the Gold Price towards the $1,935 level encompassing Pivot Point one-week R1 and Fibonacci 61.8% on one-month.


