
AUDCHF Chart Technical Outlook higher timeframes highlight a mild bullish bias
The sell-off has stalled close to the 88.6% pullback level of 0.5642. This is a common retracement level for the BC leg of a chypher pattern. A move higher from current levels and we will have pin-bar Dojis on the daily chart. This pattern will not be complete until 0.6010.
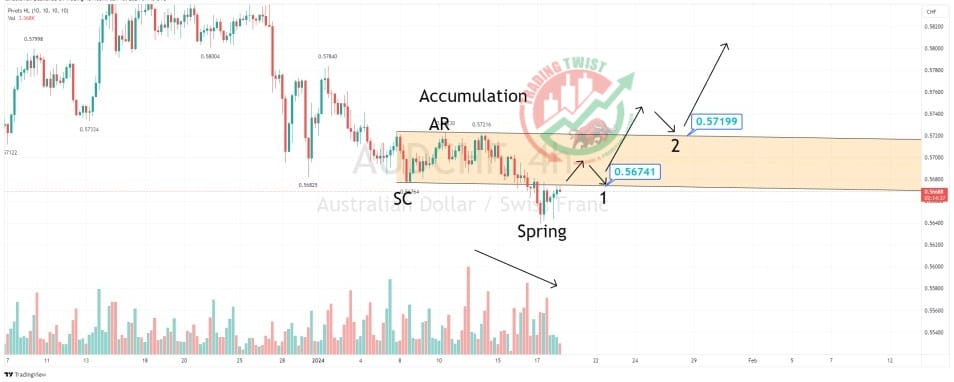
The intraday chart highlights a classic Wyckoff accumulation phase. We had the initial selling climax (SC) followed by the automatic reaction (AR) followed by the accumulation stage (smart money building longs), followed by the spring (taking out stops). This is all being achieved with lower volume.
The theory suggests waiting for a break back inside of the zone and a retest of the baseline (1). Another suggestion, and a safer option, is a break above the zone and a retest of the breakout (2).


