
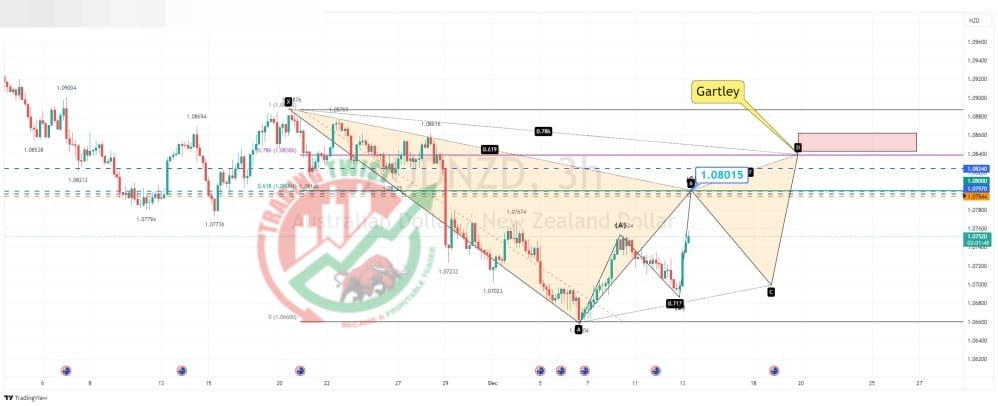
AUDNZD Chart Technical Outlook moving higher to the confluence barrier
I have a resistance barrier between 1.0794 and 1.0800. The 61.8% pullback level of the last decline is located at 1.0800. The current move to the upside looks like a corrective three-wave pattern. I look to this zone as a substantial upside barrier with the potential to correct lower within the BC leg of the Gartley formation. It should also be noted that the NZD basket highlights limited selling.


