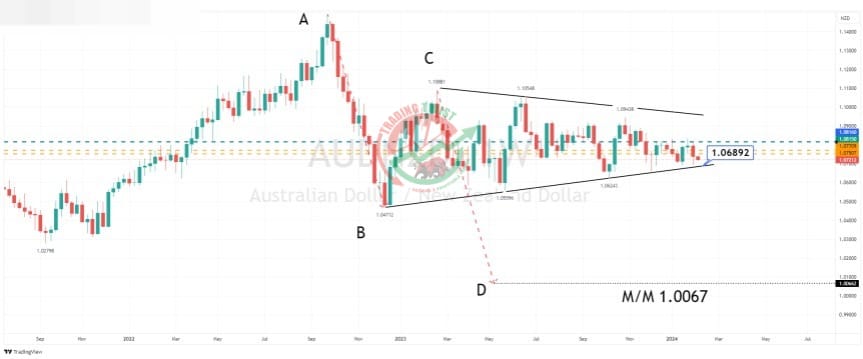
AUDNZD Chart Technical Outlook medium-term bias is bearish, but scope to sell into rallies
The weekly chart highlights mixed and volatile trading. This has produced a symmetrical triangle formation that has an eventual bias to break to the downside. On a clear break of 1.0689, the trend of higher lows, the measured move target is 1.0067.
The intraday chart highlights resistance at 1.0771 and 1.0815. With these levels lining up with a bat pattern, I would expect continued intraday volatility.
The wise move, to keep with the long-term trend, would be to sell the completion of the formation.