
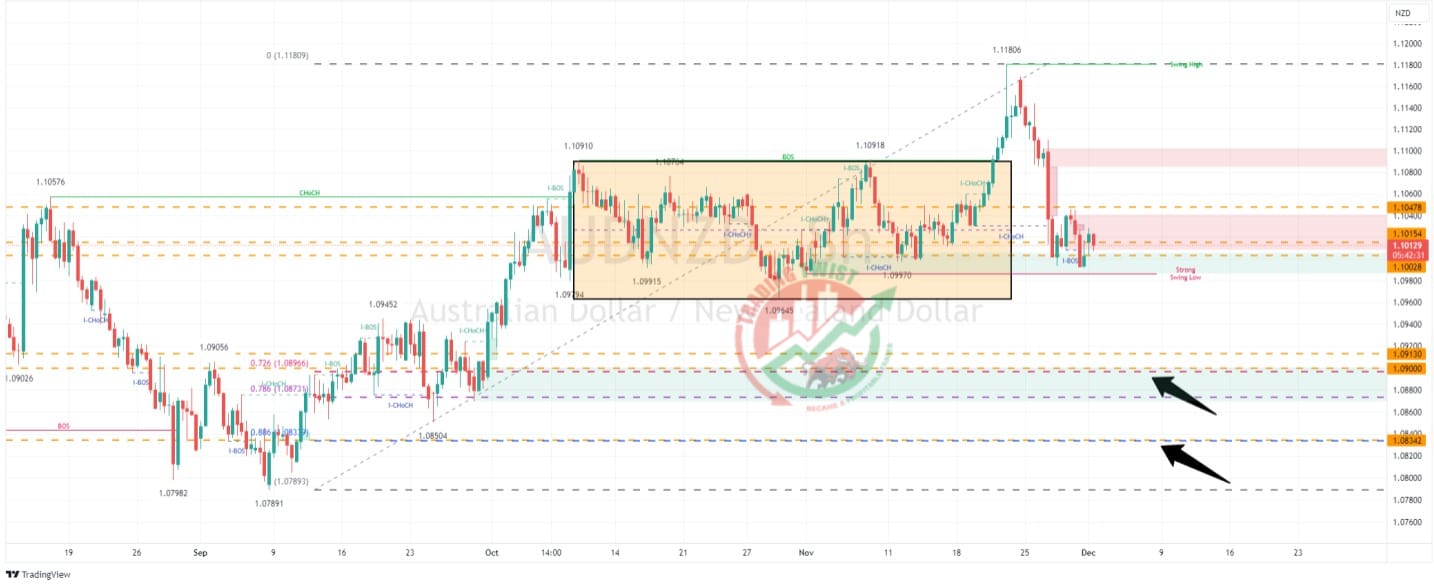
AUDNZD Chart Technical Outlook posts a Bearish Engulfing candle on the weekly chart, with resistance located at 1.1048.
A strong sell-off from the 1.1180 swing high has resulted in a Bearish Engulfing candle on the weekly chart. This formation is negative for long-term sentiment. Although we have seen a stalling in bearish momentum, I can see no logical reason for a trend change. Resistance is currently located at 1.1048. Support is not seen until 1.0913 and 1.0834. We are trading within a previous congestion zone so there is scope for consolidation.


