
AUDUSD Chart Technical Outlook positive bias to build the Gartley pattern
Although we have seen strong selling pressure overnight, the dip has been bought at the 8-hour Fibonacci confluence zone. This can be seen as the completion of a bullish Butterfly formation.
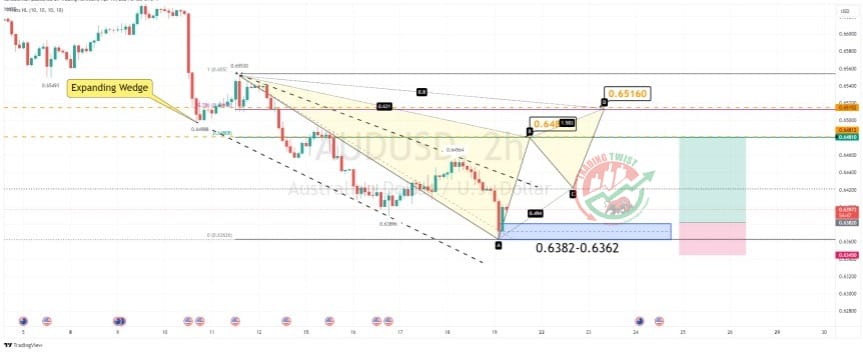
The intraday chart highlights an expanding wedge formation with a bias to break to the upside.
Bespoke resistance is located at 0.6481 and 0.6516. These barriers line up with the completion of a Gartley formation.
Conclusion: although there is scope for mild selling pressure, I look for the demand zone 0.6382 to attract buying interest.
Resistance: 0.6436 (lower highs), 0.6481 (bespoke, 61.8%), 0.6516 (bespoke)
Support: 0.6382 (demand), 0.6362 (swing low), 0.6300 (big figure)


