
AUDUSD Chart Technical Outlook confluence zone is located at 0.6605 to 0.6612
Although yesterday’s US GDP figure (gross domestic product) caused a knee-jerk reaction to the downside, the dip was bought into.
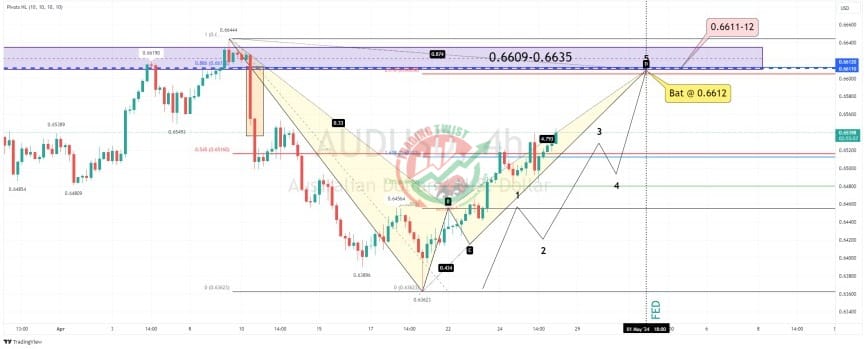
The four-hour chart highlights the pair forming a bearish Bat formation. This will be completed at 0.6612. Bespoke resistance is located at 0.6611 and 0.6612. We have a supply zone located at 0.6609 to 0.6635.
Resistance: 0.6605 (261.8%), 0.6609 (supply), 0.6612 (88.6% and bespoke)
Support: 0.6456 (swing high), 0.6362 (swing low), 0.6170 (multi-year base)


