
AUDUSD Chart Technical Outlook consolidates at the 78.6% pullback level
After a strong rally midweek, the pair consolidated yesterday posting mild net daily losses.
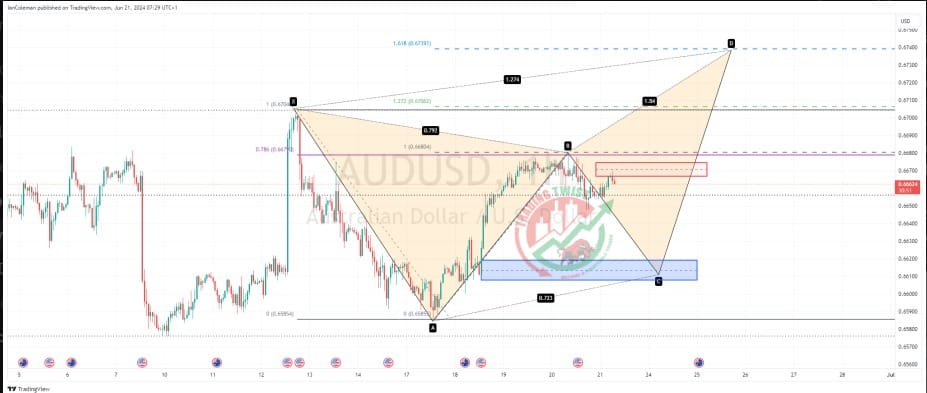
The intraday chart highlights a stalling in bullish momentum close to the 78.6% pullback level of 0.6679. This would suggest we are currently moving lower within the BC leg of a Butterfly formation. Intraday resistance is located between 0.6667 and 0.6675. Support is located between 0.6619 and 0.6608.
Conclusion: there is ample scope for a correction to the downside. I would look to the support zone to attract buying interest.


