
AUDUSD Chart Technical Outlook breaks the distribution range for a bullish trap
Fed’s Chair Powell delivers the semi-annual monetary policy report to the US Congress this afternoon. Markets are likely to continue to consolidate until this speech.
AUD/USD: the weekly chart highlights the pair stalling at the 78.6% pullback level of 0.6762.
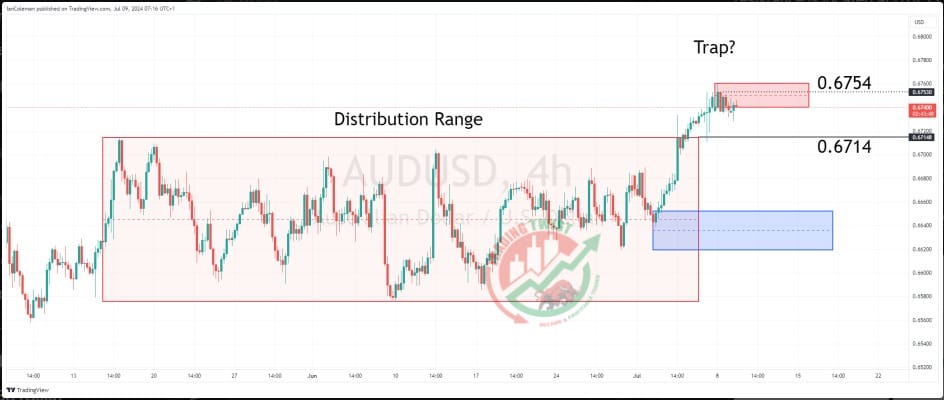
The four-hour chart highlights a prolonged period of consolidation. The Wyckoff methodology would look to this period as a ‘distribution range’ with the breakout to the upside as a possible bullish trap. Intraday resistance is located at 0.6753. A break back inside the range occurs on a move through 0.6714.
Resistance: 0.6754 (intraday), 0.6762 (78.6%), 0.6800 (Big Figure)
Support: 0.6714 (range), 0.6652 (demand), 0.6576 (swing low)


