
BTCUSD Chart Technical Outlook 78.6% holds the key to the intraday barrier
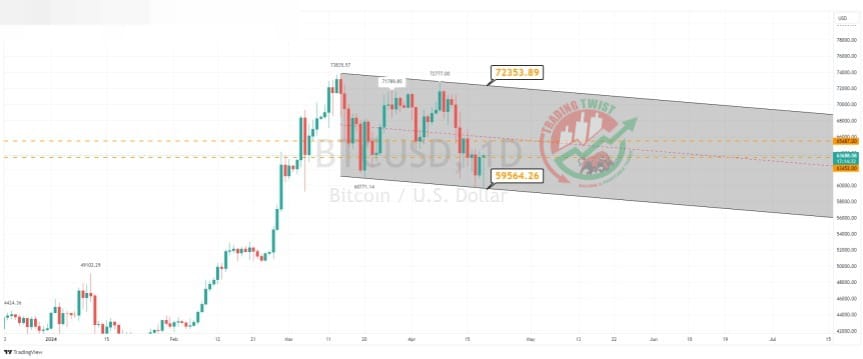
The daily chart highlights the major cryptocurrency holding within a corrective channel formation. The overnight dip has been bought close to the channel base at 59,560. It should be noted that this formation has an eventual bias to break to the upside.
The intraday chart highlights a bullish falling wedge pattern.
We have two resistance barriers of note:
- 63,452 is bespoke resistance and close to the trend of lower highs.
- 65,487 is bespoke resistance and close to the 78.6% pullback level of 65,380.
Conclusion: Although the immediate bias is bullish. I look for levels close to 65,487 to attract selling interest. I look to trade the corrective BC leg to the downside. Selling at 65,487, with a stop loss of 67,200 and a target level of 61,430 offers an R rate of 2.37.
Resistance: 63,452 (be spoke, trend of lower highs), 66,929 (swing high), 69,000 (projected butterfly)
Support: 61,845 (demand), 59,573 (swing low), 59,000


