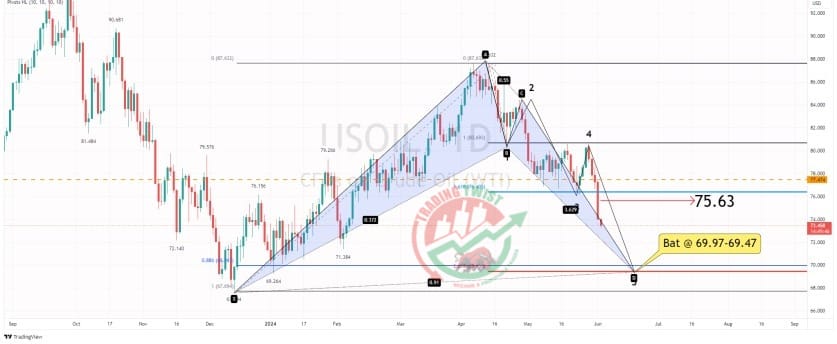
US CRUDE Oil Chart Technical Outlook diving lower to form the Bat pattern
Strong selling pressure has resulted in the previous low of $76.14 being broken and US crude oil trading to the lowest level in 82 days. Oil recorded its largest net losses in 138 days.
From a technical perspective, there is ample scope for further losses. We have a confluence area between $69.97 and $69.47. A move to this zone would form a bullish Bat pattern.
To the upside, yesterday’s strong selloff has resulted in a Marabuzo resistance level located at $75.63 (this is the midpoint of a strong negative candle). Previous support now becomes resistance at $76.14.
Conclusion: although signals for sentiment are at oversold extremes and there is ample scope for a correction to the upside, I would look for rallies to be sold.
Resistance: $75.63 (Marabuzo), $76.14 (previous support), $77.47 (bespoke)
Support: $69.97 (88.6%), $69.47 (261.8%), $67.69 (Dec 23 base)


