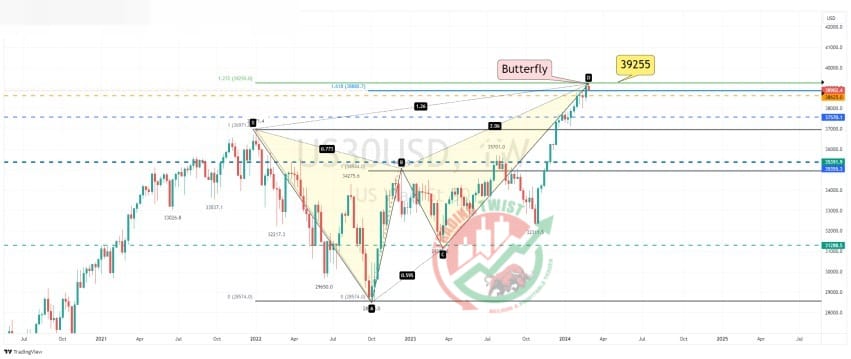
Dow Jones 30 (US30) Chart Technical Outlook The bias is bearish after the Butterfly completion Good for short-sell.
The index completed the bearish Butterfly formation at 39,255. With this being a weekly pattern, the downside correction could be substantial.
We have bespoke support located at 38,617 and 37,570. Using projection analysis, we have a five-wave count (Elliott Wave) completing at 35,570 (medium-term target)
The daily chart highlights an Ending Wedge formation. Trend line support is located at 38,615.
The intraday chart highlights a breakout of a channel formation. The reverse trend line has been tested and rejected. We are now within the bearish 5th wave lower.
Resistance: 38,955 (channel base), 39,047 (swing low), 39,278 (all-time high)
Support: 38,863 (3rd wave), 38,673 (261.8%), 38,620 (bespoke)