
Dow Jones (US30) Chart Technical Outlook trading within the ABCD correction higher
Buyers emerged under the 261.8% Fibonacci extension level of 37,504. We have seen a substantial recovery.
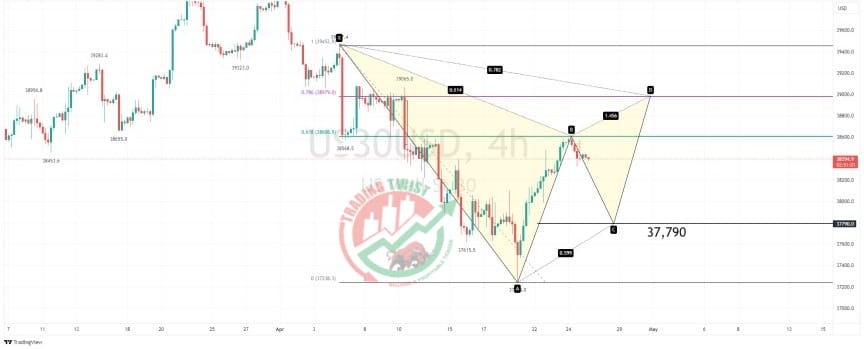
The previous swing low from April 2 is located at 39,066. What was support becomes resistance. We have the reverse trend line from the wedge breakout located at 39,146. I regard this zone as a substantial upside barrier.
The intraday chart highlights the rally stalling close to the 61.8% retracement level of 38,607. This suggests we are currently trading within the BC leg of a Gartley formation. Intraday support is located at 37,790.
Conclusion: there is no clear indication the rally has come to an end. The preferred stance would be to buy into the CD leg of the Gartley formation.
Resistance: 38,607 (61.8%), 38,979 (Gartley), 39,066 (swing low)
Support: 38,288 (bespoke), 37,790 (bespoke), 37,244 (swing low)


