
Dow Jones (US30) Chart Technical Outlook sellers return at the reverse trend line resistance
We did see some mixed and volatile price action during Fed Chair Powell’s testimony to Congress. The intraday rally was sold into.
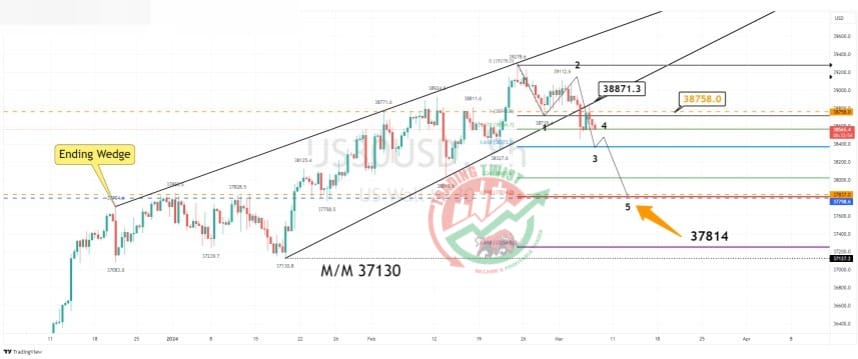
The 8-hour chart highlights a breakout of an ending wedge formation. The measured move target is located at 37,130. Bespoke support levels are located at 37,837 and 37,798. With this being close to the 261.8% extension level of 37,814, this is the focus.
Conclusion: The bias remains bearish with a retest of the wedge breakout complete. We could see a stalling in the sell-off, possibly through this afternoon’s testimony, close to the 161.8% extension of 38,373. I continue to look for any corrective rallies to find sellers.
Resistance: 38,758 (bespoke), 38,871 (reverse trend line), 39,278 (all-time high)
Support: 38,373 (161.8%), 38,327 (Feb 21 swing low), 37,814 (261.8%)


