
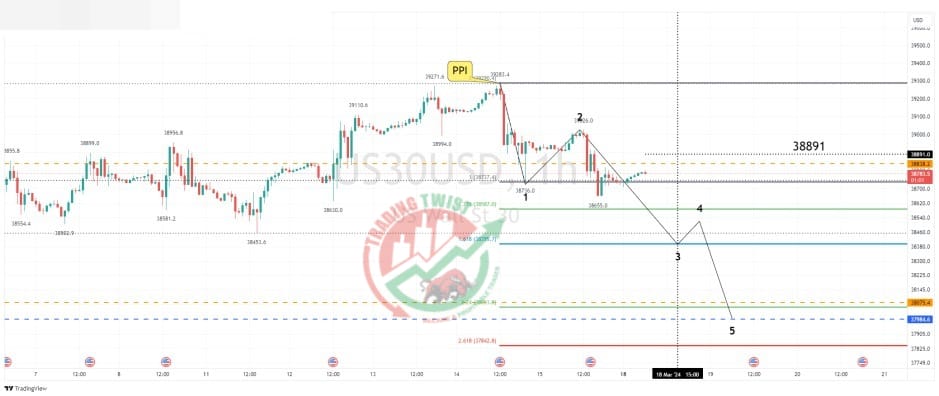
Dow Jones (US30) Chart Technical Outlook the bias remains mildly bearish towards 37,842
The index completed a bearish Butterfly formation at the 39,283 swing high.
Strong follow-through selling resulted in a bearish Outside Candle being posted on the daily chart. This formation is often seen at the top of the trend and the start of a new downward bias.
The intraday chart highlights a 261.8% extension level located at 37,842. We have bespoke support located at 37,984. Intraday resistance is located at 38,858 and 38,891.
Resistance: 38,838 (bespoke), 38,891 (DeMark barrier), 39,283 (swing high)
Support: 38,453 (swing low), 38,395 (161.8%), 37,842 (261.8%)


