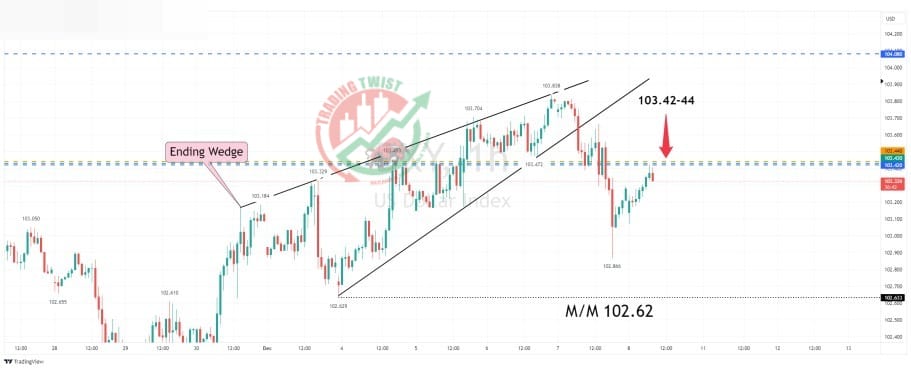
The U.S. Dollar Index DXY Chart Technical Outlook has been on a bullish trend since mid-September 2023, driven by rising interest rates and a weakening global economy. However, the index appears to be consolidating recently, potentially due to profit-taking and some positive economic data from other countries.
Key Technical Indicators:
- Moving Averages: The 200-day moving average currently acts as support at around 105.50. The 50-day moving average is at 108.75 and is trending upwards, suggesting continued bullish momentum.
- Relative Strength Index (RSI): The RSI is currently at 62, indicating the DXY is slightly overbought but still within a bullish range.
- Stochastic Oscillator: The Stochastic Oscillator is also showing overbought conditions, suggesting a potential pullback in the short term.
- Support and Resistance: Key support levels include 105.50 (200-day moving average), 104.00, and 102.00. Resistance levels include 108.75 (50-day moving average), 110.00, and 112.00.
Potential Scenarios:
- Bullish Scenario: If the DXY can break above 108.75 and 110.00, it could continue its upward trajectory towards 112.00 or higher. This scenario could be supported by further interest rate hikes in the United States and continued weakness in other major currencies.
- Neutral Scenario: If the DXY consolidates within its current range between 105.50 and 108.75, it could continue trading sideways for some time. This scenario could occur if market sentiment remains mixed and the economic data is inconclusive.
- Bearish Scenario: If the DXY breaks below 105.50 and 104.00, it could signal a more significant correction. This scenario could be triggered by unexpected economic data or a change in sentiment towards the U.S. dollar.
Disclaimer:
This technical outlook is based on current market conditions and is subject to change without notice. Please be aware that trading involves risk and you should always consult with a qualified financial advisor before making investment decisions.


