
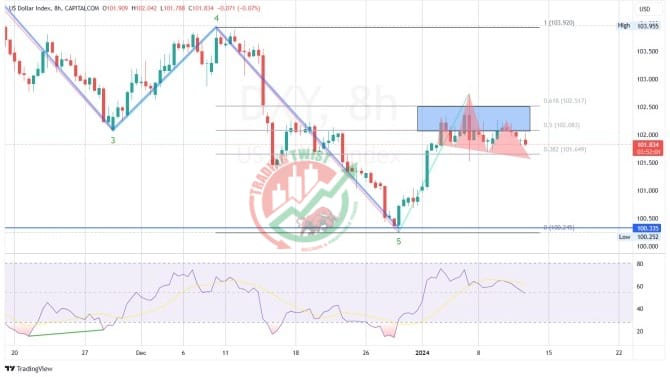
DXY Chart Technical Outlook stalled at the resistance zone in blue, between 50% and 61.8% Fibo levels, with a potential bearish head and shoulders pattern in play. The broad bias remains for the downside.
DXY Chart Technical Outlook stalled at the resistance zone in blue, between 50% and 61.8% Fibo levels, with a potential bearish head and shoulders pattern in play. The broad bias remains for the downside.


